A Global Lithosphere-Asthenosphere Boundary?
advertisement
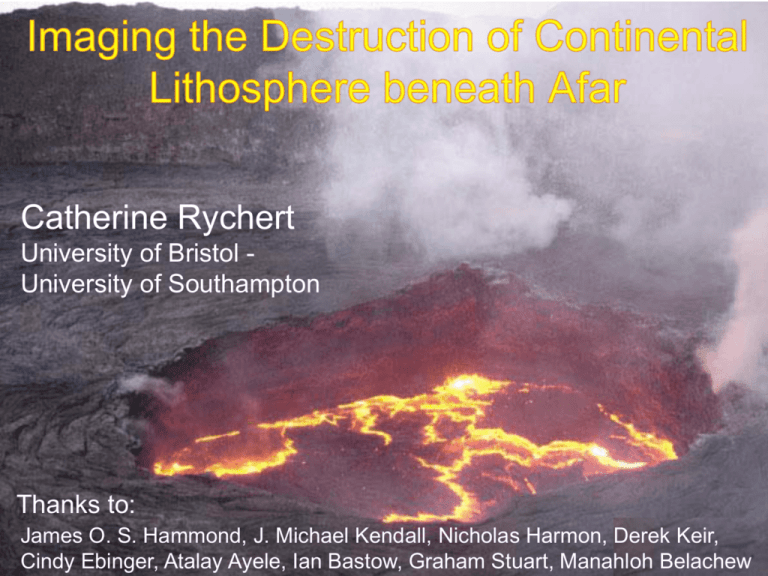
Catherine Rychert University of Bristol University of Southampton Thanks to: James O. S. Hammond, J. Michael Kendall, Nicholas Harmon, Derek Keir, Cindy Ebinger, Atalay Ayele, Ian Bastow, Graham Stuart, Manahloh Belachew What is the lithosphere-asthenosphere boundary? We would like to find the boundary between the rigid lithosphere and the convecting asthenosphere. Seismic waves resolve LAB globally. Regionally constrain character of velocity gradient, & defining mechanism. Receiver Functions [Nettles & Dziewonski, 2008] Rayleigh Waves Depth km] 0 100 200 [Rychert et al. JGR, 2007] Rychert et al., Nature, 2005] [Li et al., 2003] Globally Receiver functions – lateral coverage limited to seismic station locations [Rychert et al., 2010] [Fischer et al., 2010] SS bounces in locations where station coverage is sparse. - 300 (Li et al., 2000; Li et al., 2004; Collins et al., 2002; Wolbern et al., 06; Heit et al., 2007; Li et al., 2007; Rychert et al., 2005; Rychert et al., 2007; Snyder, 2008; Kumar et al., 2005; Sodoudi et al., 2006; Ozacar et al., 2008; Angus et al., 2006; Mohsen et al., 2006; Hansen et al., 07; Kumar et al., 2007; Wittlinger and Farra, 2007; Hansen et al., 2009; Sodoudi et al., 2009; Kumar et al., 2005; Oreshin et al., 2002; Kumar et al., 2006; Sodoudi et al., 2006; Chen et al., 2006; Chen et al., 2008; Chen, 2009; Kawakatsu et al., 2009) [Rychert & Shearer, 2011] Complications… [Nettles & Dziewonski, 2008] [Ford et al., 2010] [Yuan & Romanowicz, 2010] [Bostock, 1999] Afar triple junction – Detailed resolution of the lithosphere-asthenosphere boundary at transition of tectonic environments Motivation How is continental lithosphere destroyed? How does the depth and character of the lithosphereasthenosphere boundary vary at across a rift? Huismans & Beaumont, Nature, 2011 Method 1) Rotate recorded waveform to P and S components. Station Crust Lithosphere 2a) Bin data by conversion point, simultaneously S-to- P deconvolve and conversion migrate to depth in 1D. 2b) Extended multi-taper receiver function technique and 3-D migration. P-to-S conversion Asthenosphere Ppps Psps Ppss Sp Ps Bin by conversion point. Bin radius = ¾ degree, 75 km depth. Afar triple junction, 75 km depth Strong variation in waveform character from flank to rift. Afar triple junction, 75 km depth Velocity decreases with depth beneath the flank. Velocity increases beneath the rift. [Rychert et al., submitted] Flank cross section Results from the migrated extended multitaper method Strong LAB beneath flank, shallows beneath flood basalts Strong velocity decrease likely requires a mechanism such as melting in the asthenosphere. Flank to rift cross section Results from the migrated extended multitaper method Strong LAB beneath flank. No LAB No LAB beneath rift. Sharp transition implies rigidity of the lid. [Rychert et al., submitted] Flank to rift cross section Results from the migrated extended multitaper method Strong LAB beneath flank. No LAB No LAB beneath rift. Sharp transition implies rigidity of the lid. [Rychert et al., submitted] Good agreement with previous seismic results. 30 km or possibly 100 km Sp receiver functions 80 km [Hansen et al., 2009] Joint Ps receiver function – surface waves 70-80 km thick lid vs. no lid beneath rift [Dugda et al., 2007]. Surface waves [Fishwick et al., 2010]. Previous seismic results SKS & surface waves – aligned melting in upper 75 km. [Kendall et al., 2005; Bastow et al,. 2010] P-to-S: Moho shallows, Vp/Vs high beneath rift Body wave velocity anomalies beneath rift [Hammond et al., 2011] Synthetic Waveform Modeling 11 % @ 77 km Strong velocity decrease likely requires a mechanism such as melting in the asthenosphere. 5 % @ 41 km 7 % @ 62 km Strong velocity increase likely requires a mechanism such as a sharp decrease in melt concentration. Geodynamic Modeling Geodynamic models with high melt retention and Tp = 1350 – 1400°C match both the depth (65-85 km) and the magnitude (~8%) of the observed seismic discontinuity. Plume potential temperatures ( >= 1450°C) give velocity increase at > 100 km depth, outside error bars for depth of the seismic discontinuity. Other Supporting Evidence Africa has moved ~700 km away from the location where a plume caused flood basalt volcanism ~35 Ma [Silver et al., 1998]. Although interpreted as a thermal anomaly, the range of potential temperatures from geochemistry (1370 - 1490°C)[Rooney et al., 2011] agrees with our predicted range (1350 – 1400°C), i.e., not significantly hotter than normal mantle. Depth of melting consistent with geochemical estimates (70 – 90 km) [Furman, 2007]. Afar [Kustowski et al., 2008] [Chang & van der Lee, 2011] No plume visible beneath Afar in joint body wave surface wave tomography. Channelized flow from a low viscosity asthenosphere may provide slightly warmer material, but certainly no plume [Toomey et al., 2002; Ebinger & Sleep 1998]. Conclusions A sharp rigid lid is imaged on the flank of the Afar rift at ~75 km depth. The transition from flank to rift is abrupt. The sub-crustal lithosphere beneath the rift has been destroyed. A significant velocity increase imaged beneath the rift is consistent with geodynamic predictions for the onset of decompression melting. Its depth is shallow, indicating no significant plume influence Conclusions A sharp rigid lid is imaged on the flank of the Afar rift at ~75 km depth. The transition from flank to rift is abrupt. The sub-crustal lithosphere beneath the rift has been destroyed. A significant velocity increase imaged beneath the rift is consistent with geodynamic predictions for the onset of decompression melting. Its depth is shallow, indicating no significant plume influence today.

