Downloaded from http://rspb.royalsocietypublishing.org/ on March 5, 2016
Ecology and mode-of-life explain lifespan
variation in birds and mammals
rspb.royalsocietypublishing.org
Kevin Healy1,2,†, Thomas Guillerme1,2, Sive Finlay1,2,‡, Adam Kane1,2,‡,
Seán B. A. Kelly1,2,‡, Deirdre McClean1,2,‡, David J. Kelly1,2, Ian Donohue1,2,
Andrew L. Jackson1,2 and Natalie Cooper1,2
1
School of Natural Sciences, and 2Trinity Centre for Biodiversity Research, Trinity College Dublin, Dublin 2,
Republic of Ireland
Research
Cite this article: Healy K et al. 2014 Ecology
and mode-of-life explain lifespan variation in
birds and mammals. Proc. R. Soc. B 281:
20140298.
http://dx.doi.org/10.1098/rspb.2014.0298
Received: 5 February 2014
Accepted: 24 March 2014
Subject Areas:
evolution, ecology
Keywords:
longevity, extrinsic mortality, MCMCglmm,
volant, non-volant
AJ, 0000-0001-7334-0434
Maximum lifespan in birds and mammals varies strongly with body mass
such that large species tend to live longer than smaller species. However,
many species live far longer than expected given their body mass. This may
reflect interspecific variation in extrinsic mortality, as life-history theory predicts investment in long-term survival is under positive selection when
extrinsic mortality is reduced. Here, we investigate how multiple ecological
and mode-of-life traits that should reduce extrinsic mortality (including
volancy (flight capability), activity period, foraging environment and fossoriality), simultaneously influence lifespan across endotherms. Using novel
phylogenetic comparative analyses and to our knowledge, the most species
analysed to date (n ¼ 1368), we show that, over and above the effect of
body mass, the most important factor enabling longer lifespan is the ability
to fly. Within volant species, lifespan depended upon when (day, night,
dusk or dawn), but not where (in the air, in trees or on the ground), species
are active. However, the opposite was true for non-volant species, where
lifespan correlated positively with both arboreality and fossoriality. Our
results highlight that when studying the molecular basis behind cellular
processes such as those underlying lifespan, it is important to consider the
ecological selection pressures that shaped them over evolutionary time.
1. Introduction
Author for correspondence:
Kevin Healy
e-mail: healyke@tcd.ie
†
Zoology Building, Trinity College Dublin,
Dublin 2, Republic of Ireland.
‡
These authors contributed equally to this
study.
Electronic supplementary material is available
at http://dx.doi.org/10.1098/rspb.2014.0298 or
via http://rspb.royalsocietypublishing.org.
Lifespan, or longevity, is a fundamental life-history trait that exhibits considerable variation both within and among species. Maximum lifespan in
vertebrates, for example, ranges from up to 211 years in the bowhead whale
(Balaena mysticetus; [1]), down to just eight weeks in the pygmy goby (Eviota
sigillata; [2]). Like most other life-history traits, lifespan varies strongly
with body size such that large species tend to live longer than smaller species
[3–6]. However, many species have far longer, or indeed shorter, lives than
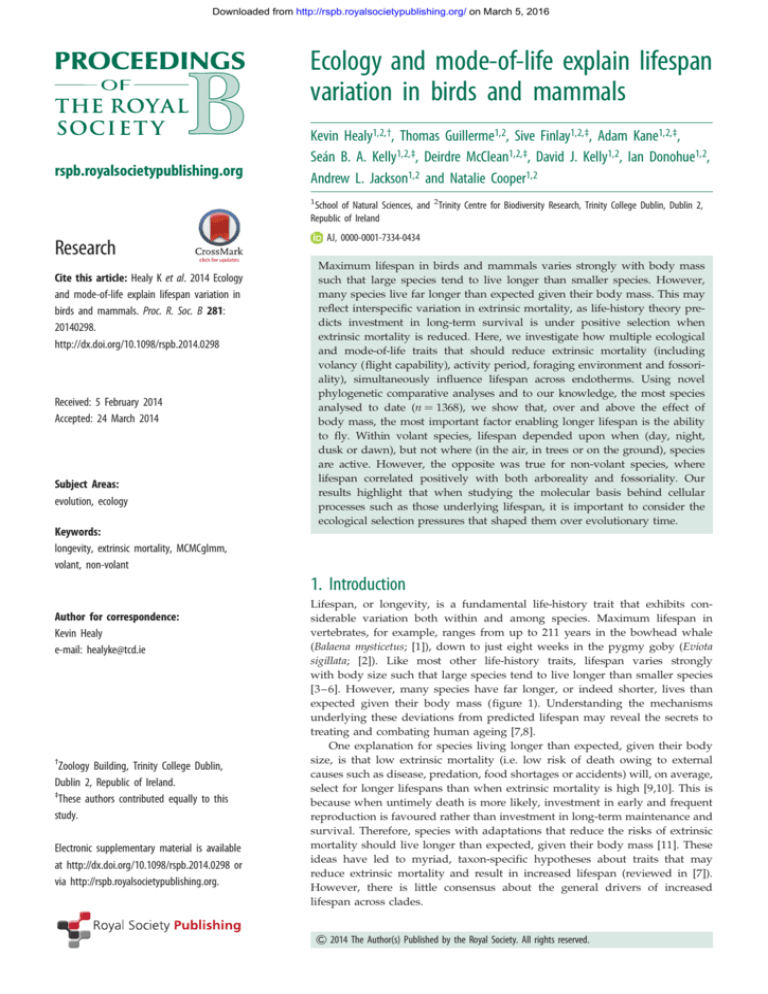
expected given their body mass (figure 1). Understanding the mechanisms
underlying these deviations from predicted lifespan may reveal the secrets to
treating and combating human ageing [7,8].
One explanation for species living longer than expected, given their body
size, is that low extrinsic mortality (i.e. low risk of death owing to external
causes such as disease, predation, food shortages or accidents) will, on average,
select for longer lifespans than when extrinsic mortality is high [9,10]. This is
because when untimely death is more likely, investment in early and frequent
reproduction is favoured rather than investment in long-term maintenance and
survival. Therefore, species with adaptations that reduce the risks of extrinsic
mortality should live longer than expected, given their body mass [11]. These
ideas have led to myriad, taxon-specific hypotheses about traits that may
reduce extrinsic mortality and result in increased lifespan (reviewed in [7]).
However, there is little consensus about the general drivers of increased
lifespan across clades.
& 2014 The Author(s) Published by the Royal Society. All rights reserved.
Downloaded from http://rspb.royalsocietypublishing.org/ on March 5, 2016
C
D
log longevity (years)
B
1.5
1.0
E
F
0.5
G
2
4
log body mass (g)
6
Figure 1. Relationships between body mass and maximum lifespan in birds
and mammals. Silhouettes highlight a selection of species with much longer
or shorter lifespans than expected given their body size. These species are
(A) Myotis brandtii, Brandt’s bat; (B) Heterocephalus glaber, naked mole rat;
(C) Vultur gryphus, Andean condor; (D) Loxodonta Africana, African elephant;
(E) Dromaius novaehollandiae, emu; (F) Dorcopsulus macleayi, Papuan forestwallaby; (G) Ceryle rudis, pied kingfisher and (H) Myosorex varius, forest
shrew. Blue points and line represent volant birds and mammals (n ¼ 662;
slope ¼ 0.25, intercept ¼ 0.73). Red points and line represent non-volant
birds and mammals (n ¼ 706; slope ¼ 0.13, intercept ¼ 0.89). Blue triangles
represent bat species and red triangles represent non-volant bird species. Estimates of slopes and intercepts represent back transformed values from mean
centred values given in table 1. (Online version in colour.)
The ability to fly, and thus more easily escape predation
and unfavourable conditions, is perhaps the most effective
way a terrestrial species can evolve to reduce its extrinsic
mortality and increase its lifespan [11– 13]. This is supported
strongly by striking differences in the lifespan of volant
(flying) and non-volant (non-flying) vertebrates; on average,
bats live 3.5 times longer than similar-sized non-volant placental mammals [14,15], whereas birds live up to four times
longer than similar-sized mammals [3,16]. However, flight
may not be the only route to reducing extrinsic mortality
and thereby increasing lifespan. Ecological factors may also
be important. Previous studies have investigated the relationship between lifespan and various ecological variables, but
most only investigated select groups of species and few
considered multiple traits simultaneously (e.g. [17]).
Here, we investigate how multiple ecological and modeof-life traits simultaneously influence maximum lifespan
across birds and mammals. We generate clear, testable
hypotheses (see below) about the relationships among lifespan and ecological and mode-of-life traits known to
influence extrinsic mortality risk; including flight capability
(volant or non-volant), activity period (diurnal, crepuscular
(i.e. active at dawn and dusk), nocturnal or cathemeral
(i.e. active both day and night)), foraging environment (terrestrial, semi-arboreal, arboreal, aerial or aquatic) and
fossoriality (i.e. living in burrows; fossorial, semi-fossorial,
non-fossorial). We then test these hypotheses across birds
and mammals using, to our knowledge, the largest
number of species to date (n ¼ 589 birds and 779 mammals)
and state-of-the-art phylogenetic comparative analyses
(including using a distribution of 500 combined bird and
mammal phylogenies) to control for the phylogenetic autocorrelation introduced by shared ancestry [18] and body
mass [3]. Together, these novel features of our analyses
2. Material and methods
(a) Data
We used maximum longevity as our measure of lifespan as it is
thought to be the best available estimator of a species’ ageing
rate [5] and because of the amount of high-quality longevity
data available. We obtained data on maximum longevity
(years) and adult body mass (g) from the AnAge database
[1,22]. In our main analysis, we excluded species with maximum
longevity estimates based on fewer than 10 longevity records, or
with low or questionable data quality as defined in the AnAge
database [5]. As maximum values are dependent on sample
size, we also ran a sensitivity analysis excluding species with
maximum longevity estimated from fewer than 100 longevity
records. This should show whether data quantity has a strong
influence on our results, though it is worth remembering that
data quality in a database such as AnAge is highly heterogeneous, and increasing sample size may not necessarily
correlate with increased data quality. Note that longevity
records for non-volant mammals tend to come from captive
individuals, whereas data for bats and birds tend to come
from wild caught individuals. Although we expect captive individuals to live longer than wild individuals, on average
maximum longevity tends to remain unchanged between captive and wild populations [23]. Further, given that bats and
birds live longer than non-volant mammals, this should make
our analyses more conservative.
To test our hypotheses concerning the relationships between
lifespan, mode-of-life and ecological traits, we collected data on
the flight capability (volant or non-volant), activity period (diurnal, crepuscular, nocturnal or cathemeral), foraging environment
Proc. R. Soc. B 281: 20140298
H
2
rspb.royalsocietypublishing.org
A
allow unprecedented testing of these key hypotheses that
underpin life-history evolution in endotherms.
We predict that, after controlling for body mass: (i) volant
species will live longer than non-volant species, because they
can more easily evade predators and unfavourable conditions
[11 –13]; (ii) nocturnal, crepuscular or cathemeral species will
live longer than diurnal species, because species that are
active at night or dusk are likely to be harder for predators
to detect [12,19]; (iii) species which forage in non-terrestrial
environments (i.e. species which feed in trees, water or aerially) will live longer than terrestrial foragers, because they
will be more capable of escaping from predators than species
that feed on the ground [13,17,20]; and (iv) fossorial
(i.e. species that live in permanent burrows) and semi-fossorial species will live longer than purely terrestrial species,
because they possess means to escape predation and
unfavourable conditions through refuge [21].
We expect that the ecological factors which influence lifespan will vary among volant and non-volant species, because
sources of extrinsic mortality will differ in these two groups.
We therefore split species into volant (most birds and all
bats) and non-volant (some birds and most mammals) subgroups, to discover general, broad-scale correlates of lifespan
in endotherms, rather than separate correlates for birds and
mammals. We then tested our hypotheses on volant and
non-volant species separately. We find that, as predicted,
after controlling for body mass and phylogeny, the most
important factor enabling longer lifespan is the ability to fly.
In addition, ecological correlates of lifespan varied among
volant and non-volant species such that the longest lived
volant species are nocturnal, cathemeral or diurnal, whereas
the longest lived non-volant species are arboreal or fossorial.
Downloaded from http://rspb.royalsocietypublishing.org/ on March 5, 2016
estimate (b)
lower CI
upper CI
fixed terms
intercept
body mass
random terms
residual variance
phylogenetic variance
–2
20.145
0.554
21.544
0.467
1.260
0.639
0.507
0.456
0.033
0.302
0.981
0.613
0.107
0.090
0.127
1.542
1.264
1.871
(terrestrial, semi-arboreal, arboreal, aerial or aquatic) and fossoriality (fossorial, semi-fossorial or non-fossorial) of each species
using Walker’s Mammals of the World [24], the Handbook of Birds
of the World series [25], the Handbook of the Birds of Europe, the
Middle East and North Africa series [26] and some additional
sources (electronic supplementary material, appendix 1,
[27 – 29]). These categories are described in detail in the electronic
supplementary material, appendix 1. We used the taxonomy of
Wilson & Reeder [30] for mammals and Jetz et al. [31] for birds.
We excluded purely aquatic mammals (Cetacea and Sirenia)
from the analyses, because we expect selection pressures to be
very different in these groups. We also excluded gliding mammals, because there were too few species (n ¼ 9) to run a
separate analysis and because this group could equally fit into
either the volant or non-volant subgroups.
Rather than basing our analyses on just a single phylogenetic
tree and assuming this tree was known without error, we instead
used a distribution of trees. We extracted 500 bird trees from the
posterior distribution of a recent bird phylogeny generated
under a Bayesian inference framework [31], and used the
10 000 mammal trees constructed by Kuhn et al. [32]. Each individual mammal tree comprises one resolution of the polytomies
of a previously published supertree [33]. We treat these as equivalent to a Bayesian posterior distribution of trees, because no
such tree analysis exists for all mammals. As we needed a distribution of phylogenies containing both birds and mammals, we
randomly selected one bird tree and one mammal tree (without
replacement) and bound them to make a combined tree. The
trees were bound with a root age of 315 million years, corresponding to the fossil calibration for all amniotes, i.e.
Archerpeton anthracos (electronic supplementary material, appendix 1; [34]). We repeated this procedure 500 times to generate a
distribution of 500 combined bird and mammal trees.
Many studies on vertebrate ageing have noted a strong correlation between maximum longevity and metabolic rate. Opinion
is divided as to whether this is a causative relationship or merely
confounded with the strong correlation between body mass and
metabolic rate [7]. To determine whether our conclusions hold
when we include metabolic rate in our models, we also compiled
mass-specific basal metabolic rate (BMR; Wg21) data (see the
electronic supplementary material, appendix 1).
In total, our analyses used data from 589 birds (579 volant and 10
non-volant) and 779 mammals (83 volant and 696 non-volant; see
the electronic supplementary material, appendix 3: table A1 for
more details and appendix 2 for the complete dataset). This was
reduced to 112 birds and 330 mammals when we include BMR in
our models, and 474 birds and 435 mammals in the sensitivity
analysis using only species with 100 or more longevity records.
–1
0
1
2
(b) Analyses
To test our hypotheses, we fitted the following three models,
with maximum longevity and body mass incorporated as continuous variables; flight capability, foraging environment, activity
period and fossoriality as factors and with body mass : flight
capability representing the interaction between body mass and
flight capability.
(1) For all species (n ¼ 1368):
maximum longevity ¼ f(body mass þ flight capability þ body
mass : flight capability).
(2) For volant species only (n ¼ 662):
maximum longevity ¼ f(body mass þ foraging environment þ
activity period).
(3) For non-volant species only (n ¼ 706):
maximum longevity ¼ f(body mass þ foraging environment þ
fossoriality þ activity period).
All analyses were carried out in R v. 3.0.2 [35]. Maximum
longevity and body mass (and BMR, see below) were log10 transformed to correct inherent skewness before being mean centred
and expressed in units of standard deviation.
We fitted our models using Bayesian phylogenetic mixed
models from the MCMCglmm package [36], to account for nonindependence in species traits introduced as a result of common
ancestry [18]. MCMCglmm uses a Markov chain Monte Carlo
(MCMC) estimation approach and accounts for non-independence
among closely related species by including the phylogenetic
relationships among species as a random variable. We determined
the number of iterations, thinning and the burn-in period for each
model run across all trees using diagnostics in the coda package
[37] and we checked for convergence between model chains
using the Gelman-Rubin statistic, the potential scale reduction
factor (PSR), with all models required to have a PSR below 1.1
[38]. Following the recommendations of Hadfield [36], we used
an uninformative inverse-Wishart distribution (with variance, V,
set to 0.5 and belief parameter, nu, set to 0.002) and a parameter
expanded prior, with a half-Cauchy distribution (described by
the parameters V ¼ 0.5, nu ¼ 1, the prior mean alpha.mu ¼ 0,
and alpha.V ¼ 102, which represents the prior standard deviation
with a scale of 10), for the random factor to improve mixing and
decrease autocorrelation among iterations.
As noted earlier, rather than using one phylogenetic tree and
assuming this tree was error free, we instead used a distribution
of 500 combined bird and mammal trees and fitted each of our
models to each of these trees. We then combined the resulting
model outputs to give model estimates which incorporate the
Proc. R. Soc. B 281: 20140298
flight capability volant
body mass: flight capability
posterior distribution
3
rspb.royalsocietypublishing.org
Table 1. Relationship between maximum longevity (years), body mass (g) and flight capability (volant or non-volant) in 1368 birds and mammals. (Estimates
are modal estimates from 500 models. Lower CI ¼ lower 95% confidence interval from 500 models. Upper CI ¼ upper 95% confidence interval from 500
models. Posterior distribution ¼ distribution of estimates from 500 models. Body mass : flight capability ¼ interaction between body mass and flight capability.
Notes: 24 000 000 iterations with 4 000 000 burn-in and thinning interval of 10 000.)
Downloaded from http://rspb.royalsocietypublishing.org/ on March 5, 2016
estimate (b)
lower CI
upper CI
fixed terms
intercept
body mass
posterior distribution
–2
20.664
0.899
2.028
1.172
0.116
0.068
20.119
20.119
0.354
0.258
0.124
20.166
20.056
20.383
0.301
0.049
0.085
20.479
20.088
20.772
0.261
20.182
20.131
20.385
0.122
0.184
1.155
0.151
0.789
0.223
1.693
0
1
2
foraging environment
aerial
arboreal
semi-arboreal
aquatic
activity period
cathemeral
crepuscular
nocturnal
random terms
residual variance
phylogenetic variance
error across the 500 trees. As the posterior outputs of MCMC
models are combinable, coefficient distributions were created
by amalgamating each coefficient posterior.
Finally, to determine whether our conclusions held when we
excluded species with fewer than 100 longevity records or when
metabolic rate was included in our models, we repeated models
1–3 with either the reduced dataset of species with 100 or more
longevity records or with BMR as an additional linear covariate.
We also repeated models 2 and 3 for birds and mammals (rather
than volant and non-volant species) separately to ensure that differences between the volant and non-volant subgroups were owing to
differences in flight capability and were not simply representing the
difference between mammals and birds. We calculated the
deviance information criteria (DIC), a hierarchical generalization
of the Akaike information criteria, for each bird and mammal
paired models and compared it to the paired volant and non-volant
models to compare model ‘fit’ of each approach.
3. Results
We found that volant species live longer than non-volant
species of a similar body mass (table 1 and figure 1). In addition,
for a given increase in body mass, the lifespans of volant species
(modal slope estimate (after converting from mean-centred
values) ¼ 0.25; table 1) increase significantly more than the lifespans of non-volant species (modal slope estimate (after
converting from mean-centred values) ¼ 0.13; table 1).
The relationships among our ecological variables and lifespan differed between the volant and non-volant subgroups.
Within volant taxa, crepuscular species (i.e. those active at
dusk and dawn) had significantly shorter lifespans than both
diurnal and nocturnal species (table 2). By contrast, activity
period was not associated with lifespan in non-volant species
(table 3). Foraging environment did not influence lifespan significantly in volant species; bats and birds that forage on the
ground do not have shorter lifespans than species that forage
in the air or in trees (table 2). Within non-volant species,
however, those foraging arboreally have longer lifespans
than those foraging terrestrially, and fossorial (i.e. burrowing)
species live longer than non-fossorial ones (table 3).
In the supplementary analysis with maximum longevity
estimates based on 100 or more records, the models showed
qualitatively comparable results to the findings in the main
analysis (electronic supplementary material, appendix 3:
tables A2–A4). When we included BMR as an additional
linear covariate into models 1–3, the results showed similar
general trends as those without BMR except with no significant
effect of crepuscularity in volant species, no effect of semiarboreality in non-volant species and a negative correlation
between BMR and longevity in non-volant species (electronic
supplementary material, appendix 3: tables A5 –A7). We
also repeated models 2 and 3 for birds and mammals (rather
than volant and non-volant species) separately. The results
were qualitatively identical apart from a predictable reduction
in the phylogenetic residual term and also a lower combined
DIC value for models 2 and 3 (modal volant and non-volant
DIC ¼ 1184) in comparison to a taxonomically split model
(modal birds and mammals DIC ¼ 1227) (electronic supplementary material, appendix 3: tables A8 –A9). The
phylogenetic residual term was high in all of our models
(model 1: 1.542; model 2: 1.555; model 3: 1.627; tables 1–3)
but was much lower in the taxonomically split bird and
mammal models, as expected given their more restricted phylogenetic scope (birds: 0.371; mammals: 0.936; electronic
supplementary material, appendix 3: table A10).
4. Discussion
As predicted, we found that volant species live longer than
non-volant species of a similar body mass after accounting
for phylogenetic relatedness. However, the effects of body
mass on lifespan in the two groups differed: similar increases
in body mass resulted in disproportionately greater increases
Proc. R. Soc. B 281: 20140298
0.668
1.035
–1
4
rspb.royalsocietypublishing.org
Table 2. Relationship between maximum longevity (years), body mass (g), foraging environment and activity period in 662 volant birds and mammals.
(Estimates are modal estimates from 500 models. Column heads explained same as given in table 1. Notes: 12 000 000 iterations with 2 000 000 burn-in and
thinning interval of 5000.)
Downloaded from http://rspb.royalsocietypublishing.org/ on March 5, 2016
estimate (b)
lower CI
upper CI
fixed terms
–2
21.433
0.449
1.467
0.614
0.213
0.148
0.070
0.022
0.358
0.274
aquatic
fossoriality
0.064
20.220
0.341
fossorial
0.437
0.088
0.785
0.035
20.081
0.149
0.060
20.050
20.056
20.194
0.173
0.096
0.038
20.075
0.153
residual variance
0.042
0.031
0.059
phylogenetic variance
1.627
1.319
1.985
–1
0
1
2
foraging environment
arboreal
semi-arboreal
semi-fossorial
activity period
cathemeral
crepuscular
nocturnal
random terms
in lifespan for volant compared with non-volant species.
Additionally, after accounting for phylogeny and body size,
the lifespans of volant species depended upon when species
are active but not where that activity occurs, whereas the
opposite was true for non-volant species. Thus, the longestlived volant birds and mammals tended to be either diurnal
or nocturnal, and the longest-lived non-volant species tended
to be arboreal, semi-arboreal or fossorial.
The link between flight and long lifespan in vertebrates
is well known. Among birds, flightless or weakly flying
species (i.e. game birds) have the shortest lifespans [6,11,14].
Among mammals, bats live far longer than similar-sized nonvolant mammals and gliding species also have greater lifespans
than expected given their body mass [12]. This probably reflects
the ability of flying species to escape sources of extrinsic mortality such as predation and unfavourable conditions, allowing
greater investment in increased lifespan [11–13].
The relationships among our ecological variables and lifespan differed between the volant and non-volant subgroups,
as expected given the different sources of extrinsic mortality
they experience. Activity period was important in volant
species, with crepuscular species possessing the shortest lifespans. This suggests that being crepuscular is a poor strategy
for volant species, perhaps because they are exposed to both
diurnal and nocturnal predators, resulting in higher extrinsic
mortality. The scarcity of crepuscular volant species (n ¼ 16)
in our dataset also suggests that specialization to be active
between nocturnal and diurnal periods is a relatively unsuccessful strategy. However, activity period was not related to
lifespan in non-volant species, counter to our initial prediction that nocturnal, crepuscular and cathemeral species
would be more long-lived, which assumed that diurnal
species would be easier for predators to detect. However,
there are many additional ways to avoid predation (see
below) and many alternative reasons for becoming nocturnal,
crepuscular or cathemeral. For example, many large mammals are crepuscular or cathemeral in order to avoid the
intense heat of the day in tropical areas, while species such
as wolves and hyenas may have become nocturnal to
access more prey. Consequently, although nocturnality may
decrease extrinsic mortality for some species, it may actually
increase it for others.
Foraging environment did not influence lifespan significantly in volant species, but it was important in non-volant
species where arboreal, semi-arboreal and fossorial species
had longer lifespans than terrestrial species. The relationship
between arboreality and extended lifespan in mammals has
been shown previously [17], but to the best of our knowledge
this is the first comparative analysis of lifespan in fossorial
versus non-fossorial species. Our results may, therefore,
offer a partial explanation for the exceptional longevity of
naked mole rats (Heterocephalus glaber) which are completely
fossorial and live 10 times longer than expected, given their
body size [21].
Across all our models, body size was correlated strongly
with lifespan, which is consistent with previous studies
(e.g. [3,5,6]). However, our study is the first, to our knowledge,
to demonstrate the general importance of body size in both
volant and non-volant species concurrently (as opposed to traditional taxonomic groupings of birds, bats and terrestrial
mammals separately). Large species are expected to live
longer than small species, in part, because they should experience lower rates of extrinsic mortality and therefore invest more
in long-term maintenance and survival. For example, large
species are expected to suffer lower predation risk, and be
better able to cope with temporary food shortages, climatic
fluctuations and extreme weather compared with smaller
species [15,39]. Also following from Peto’s paradox, that
Proc. R. Soc. B 281: 20140298
0.013
0.531
intercept
body mass
posterior distribution
5
rspb.royalsocietypublishing.org
Table 3. Relationship between maximum longevity (years), body mass (g), foraging environment, fossoriality and activity period in 706 non-volant birds and
mammals. (Estimates are modal estimates from 500 models. Column heads explained same as given in table 1. Notes: 24 000 000 iterations with 4 000 000
burn-in and thinning interval of 10 000.)
Downloaded from http://rspb.royalsocietypublishing.org/ on March 5, 2016
Acknowledgements. We thank the members of NERD club for insightful
discussions, Gavin Thomas for assistance with the bird phylogeny,
Luke McNally for suggestions on the analysis and the anonymous
reviewers for their helpful suggestions.
Data accessibility. All data used in these analyses are available in the
electronic supplementary material, appendix 2.
Funding statement. Funding was provided by the Earth and Natural
Sciences (ENS) Doctoral Studies Programme, funded by the Higher
Education Authority (HEA) through the Programme for Research
at Third Level Institutions, Cycle 5 (PRTLI-5), co-funded by the
European Regional Development Fund (ERDF) (K.H.); IRC Embark
Initiative Postgraduate Scholarship (S.F.); Trinity College Dublin
(T.G., A.K., S.K.), the EU INTERREG IVA Cross-border Programme-funded DOLMANT Project (ref. no: 002862; D.M.) and
European Commission CORDIS Seventh Framework Programme
(FP7) Marie Curie CIG grant ( proposal no: 321696; N.C.). All calculations were performed on the Lonsdale cluster maintained by the
Trinity Centre for High Performance Computing. This cluster was
funded through grants from Science Foundation Ireland.
References
1.
2.
3.
de Magalhães JP, Costa J. 2009 A database of
vertebrate longevity records and their relation
to other life-history traits. J. Evol. Biol.
22, 1770 –1774. (doi:10.1111/j.1420-9101.2009.
01783.x)
Depczynski M, Bellwood DR. 2005 Shortest recorded
vertebrate lifespan found in a coral reef fish. Curr. Biol.
15, R288–R289. (doi:10.1016/j.cub.2005.04.016)
Lindstedt S, Calder III W. 1981 Body size,
physiological time, and longevity of homeothermic
animals. Q. Rev. Biol. 56, 1–16. (doi:10.1086/
412080)
4.
5.
6.
Promislow DEL. 1993 On size and survival:
progress and pitfalls in the allometry of life span.
J. Gerontol. 48, B115 –B123. (doi:10.1093/geronj/
48.4.B115)
de Magalhães JP, Costa J, Church GM. 2007 An
analysis of the relationship between metabolism,
developmental schedules, and longevity using
phylogenetic independent contrasts. J. Gerontol. Series
A: Biol. Sci. Med. Sci. 62, 149–160. (doi:10.1093/
gerona/62.2.149)
Ricklefs RE. 2010 Life-history connections to rates of
aging in terrestrial vertebrates. Proc. Natl Acad. Sci.
7.
8.
9.
USA 107, 10 314–10 319. (doi:10.1073/pnas.
1005862107)
Ricklefs RE. 2010 Insights from comparative
analyses of aging in birds and mammals. Aging
Cell 9, 273 –284. (doi:10.1111/j.1474-9726.2009.
00542.x)
Zhang G et al. 2013 Comparative analysis of bat
genomes provides insight into the evolution of
flight and immunity. Science 339, 456– 460.
(doi:10.1126/science.1230835)
Stearns SC. 1992 The evolution of life histories.
Oxford, UK: Oxford University Press.
6
Proc. R. Soc. B 281: 20140298
reputed extreme lifespans [14], yet, of the 32 species with the
top 5% of residuals in our models of maximum lifespan against
body size, foraging environment and activity period, less than
half are bats. Instead, flying foxes (Pteropodidae) are scattered
among the birds and fit the volant species regression line well,
as do most microchiropteran bats. This suggests that the prolonged lifespans of most bats are not exceptional, given their
volant mode-of-life. In our models, the exceptionally long-lived
bats are mostly Vespertilionidae (Barbastella barbastellus, Myotis
blythii, Myotis brandtii, Myotis daubentonii, Myotis evotis, Myotis
lucifugus, Myotis myotis, Myotis mystacinus, Myotis nattereri,
Myotis volans, Plecotus auritus and Plecotus austriacus) plus Desmodus rotundus, Rhinolophus ferrumequinum and Rhinolophus
hipposideros. However, the species in the top 5% of residuals
also include pelagic seabirds (Alca torda, Uria aalge, Pelecanus erythrorhynchos, Pelecanus occidentalis, Pelecanus onocrotalus,
Diomedea epomophora, Diomedea exulans, Phoebastria immutabilis,
Phoebastria nigripes, Thalassarche chrysostoma, Thalassarche melanophrys, Fulmarus glacialis, Puffinus puffinus, Fregata minor and
Haliaeetus albicilla), parrots (Cacatua leadbeateri), flamingos (Phoenicopterus roseus), swans (Cygnus olor) and even diving ducks
(Aythya fuligula). The mechanisms underlying the exceptional
lifespans of these species are likely to be idiosyncratic, given
the broad array of ecologies these birds exhibit. Thus, if we
want to uncover the secrets of long life, we may need to
expand our search beyond bats and naked mole rats [8,41].
When studying the molecular basis behind cellular processes
such as those underlying longevity, it is important to consider
the selection pressures that shaped them over evolutionary time.
rspb.royalsocietypublishing.org
cancer incidence does not correlate with body size despite the
larger number of cells from which it can potentially develop
[40], the increased lifespan afforded through decreased extrinsic mortality in large species can increase selection for
molecular controls on senescence related diseases [11].
Previous studies generated similar slopes for the relationship
between log lifespan and log body mass in birds (slope ¼ 0.20)
and mammals (slope ¼ 0.22), but the bird slope had a much
higher intercept [3,39]. By contrast, we found that, for a given
increase in body mass, the lifespans of volant species (modal
slope estimate (after converting from mean-centred values) ¼
0.25) increase significantly more than the lifespans of nonvolant species (modal slope estimate (after converting from
mean-centred values) ¼ 0.13). This suggests that the similarities
in bird and mammal slopes seen previously may have been the
result of splitting species into taxonomic rather than ecological
groups. The explanation for the steeper slope in volant species
is unclear. However, we suggest that increasing body mass in
volant species reduces their extrinsic mortality much more markedly than it does in non-volant species, favouring greater
investment in long-term survival. Alternatively, this may reflect
constraints on life-history optimization, particularly in bats,
where the energetic and biomechanical requirements of flight
restrict females to raising small litters [24]. This leaves few
options for the optimization of life history in bats other than
increasing lifespan, thereby increasing lifetime opportunities
for reproduction.
For birds and mammals, the most important factor in reducing extrinsic mortality and allowing investment in a longer
lifespan, after controlling for body size and phylogeny, is the ability to fly. This effect is so strong that it overshadows all other
ecological variables explaining lifespan variation in volant
species. However, there is still residual variation in all of our
models. Much of this is related to phylogeny, particularly in
volant species because this group contains a fairly even
number of mammals (bats) and birds. On the other hand,
owing to the paucity of lifespan data resulting in so few nonvolant birds in our dataset (n ¼ 10), the phylogenetic residuals
in the non-volant model are unlikely to be attributed to the
inclusion of birds species in the mammal dominated nonvolant models. But even accounting for phylogeny (as we do
in all our models), there is still substantial unexplained variation
in the model for volant species (residual error ¼ 0.18 in the
model for volant species compared with 0.042 in the model for
non-volant species; tables 2 and 3). We anticipated such unexplained variation would be related to bats because of their
Downloaded from http://rspb.royalsocietypublishing.org/ on March 5, 2016
21.
22.
24.
25.
26.
27.
28.
29.
30.
31.
32.
33.
34.
35.
36.
37.
38.
39.
40.
41.
time. Nature 491, 444 – 448. (doi:10.1038/
nature11631)
Kuhn TS, Mooers AØ, Thomas GH. 2011 A simple
polytomy resolver for dated phylogenies. Methods
Ecol. Evol. 2, 427–436. (doi:10.1111/j.2041-210X.
2011.00103.x)
Bininda-Emonds ORP et al. 2007 The delayed rise of
present-day mammals. Nature 446, 507–512.
(doi:10.1038/nature05634)
Reisz RR, Müller J. 2004 Molecular timescales and
the fossil record: a paleontological perspective.
Trends Genet. 20, 237–241. (doi:10.1016/j.tig.2004.
03.007)
R Development Core Team. 2012 R: a language and
environment for statistical computing. Vienna,
Austria: R Foundation for Statistical Computing.
Hadfield JD. 2010 MCMC methods for multiresponse generalized linear mixed models: the
MCMCglmm R package. J. Stat. Softw. 33, 1– 22.
Plummer M, Best N, Cowles K, Vines K. 2006 CODA:
convergence diagnosis and output analysis for
MCMC. R News 6, 7–11.
Gelman A, Rubin DB. 1992 Inference from
iterative simulation using multiple sequences.
Statist. Sci. 7, 457–472. (doi:10.1214/ss/
1177011136)
Hulbert A, Pamplona R, Buffenstein R, Buttemer W.
2007 Life and death: metabolic rate, membrane
composition, and life span of animals. Physiol. Rev.
87, 1175–1213. (doi:10.1152/physrev.00047.2006)
Peto R, Roe F, Lee P, Levy L, Clack J. 1975 Cancer
and ageing in mice and men. Br. J. Cancer 32,
411–426. (doi:10.1038/bjc.1975.242)
Tian X et al. 2013 High-molecular-mass hyaluronan
mediates the cancer resistance of the naked mole
rat. Nature 499, 346–349. (doi:10.1038/
nature12234)
7
Proc. R. Soc. B 281: 20140298
23.
in mammals. Integr. Comp. Biol. 51, 991–1001.
(doi:10.1093/icb/icr069)
Buffenstein R, Jarvis JUM. 2002 The naked mole rat:
a new record for the oldest living rodent. Sci. Aging
Knowl. Environ. 2002, pe7. (doi:10.1126/sageke.
2002.21.pe7)
Tacutu R, Craig T, Budovsky A, Wuttke D, Lehmann
G, Taranukha D, Costa J, Fraifeld VE, de Magalhães
JP. 2013 Human ageing genomic resources:
integrated databases and tools for the biology and
genetics of ageing. Nucleic Acids Res. 41,
D1027 –D1033. (doi:10.1093/nar/gks1155)
Ricklefs RE, Scheuerlein A. 2001 Comparison of
aging-related mortality among birds and mammals.
Exp. Gerontol. 36, 845–857. (doi:10.1016/S05315565(00)00245-X)
Nowak RM. 1999 Walker‘s mammals of the world.
Baltimore, MD: The Johns Hopkins University Press.
del Hoyo J, Elliott A, Sargatal J. 1992 Handbook of
the birds of the world, vol. 1: ostrich to ducks.
Barcelona, Spain: Lynx Edicions.
Cramp S. 1977 Handbook of the birds of Europe, the
Middle East, and North Africa: the birds of the
Western Palearctic, vol. 1, ostrich to ducks. Oxford,
UK: Oxford University Press.
Fry HC, Fry K. 2010 Kingfishers, bee-eaters and
rollers: a handbook. London, UK: A & C Black.
Juniper T, Parr M. 2003 Parrots: a guide to parrots
of the world. London, UK: A&C Black.
Williams TD. 1995 The penguins: Spheniscidae.
Oxford, UK: Oxford University Press.
Wilson DE, Reeder DAM. 2005 Mammal species of
the world: a taxonomic and geographic reference,
3rd edn. Washington, DC: Smithsonian Institution
Press.
Jetz W, Thomas GH, Joy JB, Hartmann K, Mooers
AO. 2012 The global diversity of birds in space and
rspb.royalsocietypublishing.org
10. Williams GC. 1957 Pleiotropy, natural selection, and
the evolution of senescence. Evolution 11,
398–411. (doi:10.2307/2406060)
11. Partridge L, Barton NH. 1993 Optimality, mutation
and the evolution of ageing. Nature 362, 305–311.
(doi:10.1038/362305a0)
12. Holmes DJ, Austad SN. 1994 Fly now, die later:
life-history correlates of gliding and flying in
mammals. J. Mammal. 75, 224–226. (doi:10.2307/
1382255)
13. Pomeroy D. 1990 Why fly? The possible benefits for
lower mortality. Biol. J. Linnean Soc. 40, 53– 65.
(doi:10.1111/j.1095-8312.1990.tb00534.x)
14. Wilkinson GS, South JM. 2002 Life history, ecology
and longevity in bats. Aging Cell 1, 124 –131.
(doi:10.1046/j.1474-9728.2002.00020.x)
15. Austad SN, Fischer KE. 1991 Mammalian aging,
metabolism, and ecology: evidence from the bats
and marsupials. J. Gerontol. 46, B47– B53. (doi:10.
1093/geronj/46.2.B47)
16. Holmes D, Ottinger M. 2003 Birds as long-lived
animal models for the study of aging. Exp.
Gerontol. 38, 1365 –1375. (doi:10.1016/j.exger.
2003.10.018)
17. Shattuck MR, Williams SA. 2010 Arboreality has
allowed for the evolution of increased longevity in
mammals. Proc. Natl Acad. Sci. USA 107,
4635–4639. (doi:10.1073/pnas.0911439107)
18. Harvey PH, Pagel MD. 1991 The comparative method
in evolutionary biology. Oxford, UK: Oxford
University Press.
19. Promislow DEL, Harvey PH. 1990 Living fast and
dying young: a comparative analysis of life-history
variation among mammals. J. Zool. 220, 417–437.
(doi:10.1111/j.1469-7998.1990.tb04316.x)
20. Byrnes G, Spence AJ. 2011 Ecological and
biomechanical insights into the evolution of gliding

