WORD document about winds and weather maps which includes
advertisement
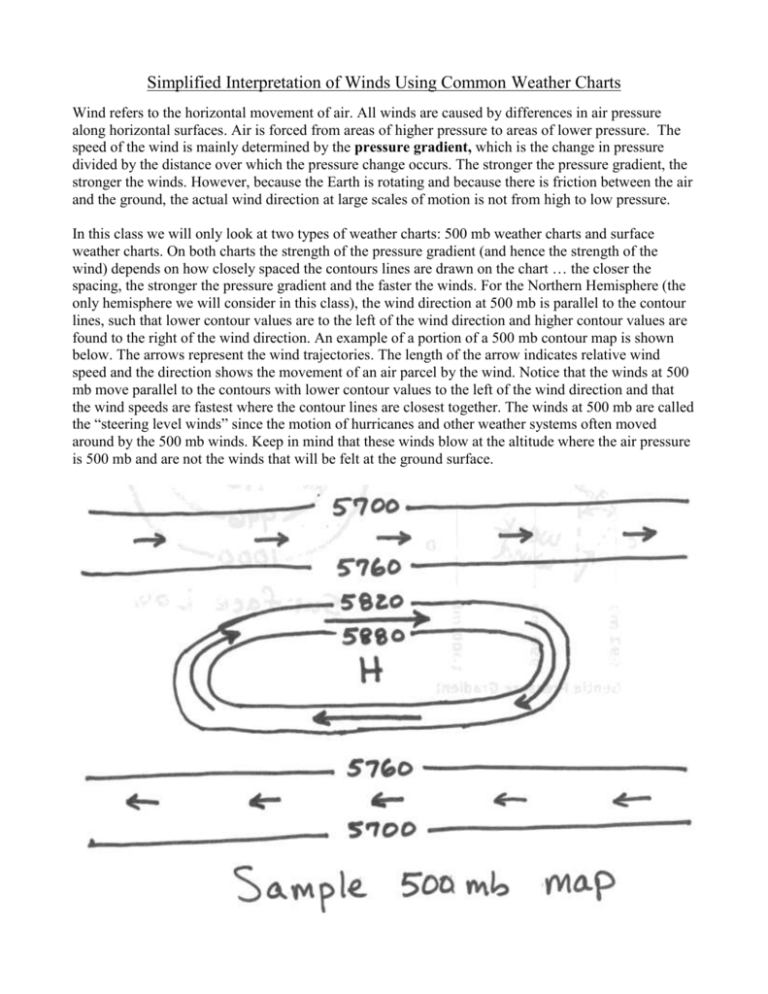
Simplified Interpretation of Winds Using Common Weather Charts Wind refers to the horizontal movement of air. All winds are caused by differences in air pressure along horizontal surfaces. Air is forced from areas of higher pressure to areas of lower pressure. The speed of the wind is mainly determined by the pressure gradient, which is the change in pressure divided by the distance over which the pressure change occurs. The stronger the pressure gradient, the stronger the winds. However, because the Earth is rotating and because there is friction between the air and the ground, the actual wind direction at large scales of motion is not from high to low pressure. In this class we will only look at two types of weather charts: 500 mb weather charts and surface weather charts. On both charts the strength of the pressure gradient (and hence the strength of the wind) depends on how closely spaced the contours lines are drawn on the chart … the closer the spacing, the stronger the pressure gradient and the faster the winds. For the Northern Hemisphere (the only hemisphere we will consider in this class), the wind direction at 500 mb is parallel to the contour lines, such that lower contour values are to the left of the wind direction and higher contour values are found to the right of the wind direction. An example of a portion of a 500 mb contour map is shown below. The arrows represent the wind trajectories. The length of the arrow indicates relative wind speed and the direction shows the movement of an air parcel by the wind. Notice that the winds at 500 mb move parallel to the contours with lower contour values to the left of the wind direction and that the wind speeds are fastest where the contour lines are closest together. The winds at 500 mb are called the “steering level winds” since the motion of hurricanes and other weather systems often moved around by the 500 mb winds. Keep in mind that these winds blow at the altitude where the air pressure is 500 mb and are not the winds that will be felt at the ground surface. The other type of weather chart is the surface weather chart. The basic rules for estimating wind speed and wind direction are the same as for the 500 mb contour map, except that the wind direction is turned about 30° toward lower pressure instead of being exactly parallel to the contour lines. Some example wind trajectories based on the pattern of contour lines for surface maps are shown below. These are the winds that blow along the ground surface. Note that the pattern of winds around a circular area of low pressure is both counterclockwise and inward (or converging). The air flow is spiraling inward. Low pressure areas on surface weather maps often indicate weather-making systems, for example winter storm systems and hurricanes have central areas of low pressure at the surface. The convergence forces air to move upward, which results in the formation of clouds. For a circular area of surface high pressure (not shown below), the winds will be clockwise and outward (or diverging). The air flow is spiraling outward. The divergence forces air to move downward, which results in fair weather. Thus, stormy weather is often associated with surface low pressure areas and fair weather with surface highs.

