Chapter 5 Notes
advertisement
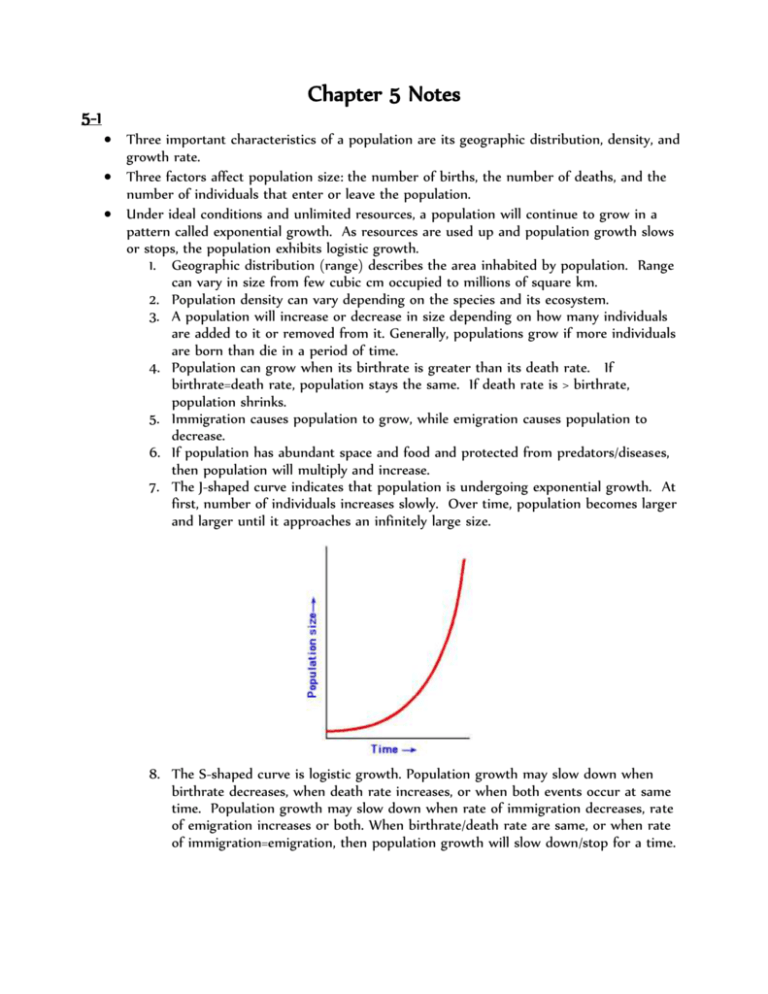
Chapter 5 Notes 5-1 Three important characteristics of a population are its geographic distribution, density, and growth rate. Three factors affect population size: the number of births, the number of deaths, and the number of individuals that enter or leave the population. Under ideal conditions and unlimited resources, a population will continue to grow in a pattern called exponential growth. As resources are used up and population growth slows or stops, the population exhibits logistic growth. 1. Geographic distribution (range) describes the area inhabited by population. Range can vary in size from few cubic cm occupied to millions of square km. 2. Population density can vary depending on the species and its ecosystem. 3. A population will increase or decrease in size depending on how many individuals are added to it or removed from it. Generally, populations grow if more individuals are born than die in a period of time. 4. Population can grow when its birthrate is greater than its death rate. If birthrate=death rate, population stays the same. If death rate is > birthrate, population shrinks. 5. Immigration causes population to grow, while emigration causes population to decrease. 6. If population has abundant space and food and protected from predators/diseases, then population will multiply and increase. 7. The J-shaped curve indicates that population is undergoing exponential growth. At first, number of individuals increases slowly. Over time, population becomes larger and larger until it approaches an infinitely large size. 8. The S-shaped curve is logistic growth. Population growth may slow down when birthrate decreases, when death rate increases, or when both events occur at same time. Population growth may slow down when rate of immigration decreases, rate of emigration increases or both. When birthrate/death rate are same, or when rate of immigration=emigration, then population growth will slow down/stop for a time. 9. Horizontal line on logistic graph that intersects y-axis tells the size of population when average growth rate reaches zero. That number represents largest number of individuals that a given environment can support (carrying capacity). 5-2 Density-dependent limiting factors include competition, predation, parasitism, and disease. Unusual weather, natural disasters, seasonal cycles, and certain human activities—such as damming rivers and clear-cutting forests—are all examples of density-independent limiting factors. 1. Primary productivity of ecosystem can be reduced when there’s an insufficient supply of particular nutrients, called limiting nutrients. Limiting nutrients example of a limiting factor. 2. A resource base that is limited can also affect long-term survival of species. 3. Density-dependent factors become limiting only when the population density (number of organism per unit area) reaches a certain level. These factors operate most strongly when a population is large and dense; they don’t affect small, scattered populations as greatly. 4. When populations become crowded, organisms compete w/ one another for food, water, space, sunlight, and other essentials. Competition among members of same species is density-dependent limiting factor. More individuals in an area, sooner they use up available resources. Fewer numbers of individuals, more resources available to them and less they must compete w/ one another. 5. Competition can also occur between members of different species. This type of competition is major force behind evolutionary change. Over time, species may evolve to occupy separate niches b/c they are both under pressure to change in ways that decrease their competition. 6. Populations in nature often controlled by predation. Example of predator-prey relationship is interaction among wolves and moose. Periodic increases in moose population quickly followed by increases in wolf population. As wolves prey on moose, population of moose falls. Decline in moose population followed by decline in wolf population b/c not much food. Decline in wolf population means moose population rises. Cycle repeats 7. Parasites can also limit growth of population. Parasitic organisms range from microscopic to long tapeworms. Like predators, parasites take nourishment at expense of their hosts, often weakening them and causing disease or death. 8. In response to density-independent factors, many species show crash in population size. After crash, population may soon build up again. For some populations, storms/hurricanes can nearly extinguish population. Extremes of hot/cold can take toll on a population, regardless of population’s density. 9. Environments always changing and most populations can adapt to certain amount of change. Populations often grow and shrink in response to changes. 5-3 Like the populations of many other living organisms, the size of the human population tends to increase with time. The characteristics of populations, and the social and economic factors that affect them, explain why some countries have high population growth rates while populations of other countries grow slowly or not at all. 1. About 500 years ago, human population began growing rapidly and food supply was reliable, improved sanitation, medicine, and health care reduced death rate. 2. Two centuries ago, Thomas Malthus observed that human populations were growing rapidly. Malthus predicted that growth wouldn’t continue forever. 3. Demography examines the characteristics of human populations and attempts to explain how those populations will change over time. 4. With advances in nutrition, sanitation, and medicine, more children survive to adulthood and more adults live to old age. These changes lower death rate and begin demographic transition. During demo. Transition, births greatly exceed deaths, and population increases. Demographic transition is complete when birthrate falls to meet death rate and population ^ stops. 5. Population growth depends on how many people of different ages make up a given population. Age-structure diagrams show population of a country broken down by gender and age group. Each bar represents individuals within a 5-year group. US predict a slow but steady growth rate for near future. 6. To predict how world’s human population will grow, demographers must consider factors like age structure of each country and prevalence of life-threatening diseases. Current projections suggest that by 2050, world population reach more than 9 billion people 7. By 2050 growth rate may level off/decrease. A lower growth rate means that human population will be growing more slowly over nest 50 years, but b/c growth rate is larger than zero, our population will continue to grow.
