Compare the age structure distribution of developed countries in
advertisement
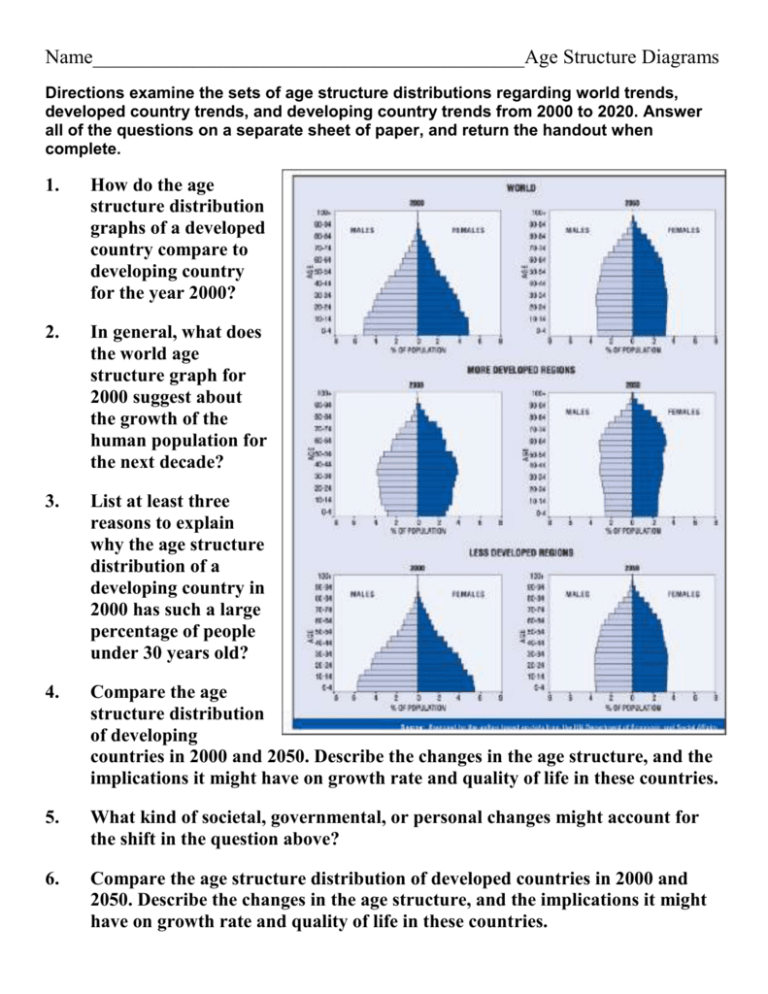
Name___________________________________________Age Structure Diagrams Directions examine the sets of age structure distributions regarding world trends, developed country trends, and developing country trends from 2000 to 2020. Answer all of the questions on a separate sheet of paper, and return the handout when complete. 1. How do the age structure distribution graphs of a developed country compare to developing country for the year 2000? 2. In general, what does the world age structure graph for 2000 suggest about the growth of the human population for the next decade? 3. List at least three reasons to explain why the age structure distribution of a developing country in 2000 has such a large percentage of people under 30 years old? 4. Compare the age structure distribution of developing countries in 2000 and 2050. Describe the changes in the age structure, and the implications it might have on growth rate and quality of life in these countries. 5. What kind of societal, governmental, or personal changes might account for the shift in the question above? 6. Compare the age structure distribution of developed countries in 2000 and 2050. Describe the changes in the age structure, and the implications it might have on growth rate and quality of life in these countries. 7. If you were a political official or government agency worker in a developed country in 2050, what kind of programs or changes might you make to ensure a high quality of life given the higher percentage of the population that is living to be much older? 8. In the space below, sketch the basic shapes of the age structure distributions for the four following countries a country with a high growth rate, a moderate growth rate, stable or zero population (ZPG) growth rate, and a country with a negative growth rate (decreasing population). High Growth Moderate Growth Stable (zero) Negative Growth
