What is business statistics?
advertisement
The Two Statistical Representations of a Population
The following figure depicts a typical relationship between the cumulative distribution
function (cdf) and the density (for continuous random variables)
All characteristics of the population are well described by either of these two functions.
The figure also illustrates their applications in determining the (lower) percentile
measures denoted by P:
P = P[ X x] = Probability that the random variable
X is less than or equal to a given number x,
among other useful information. Notice that the probability P is the area under the density
function curve, while numerically equal to the height of cdf curve at point x.
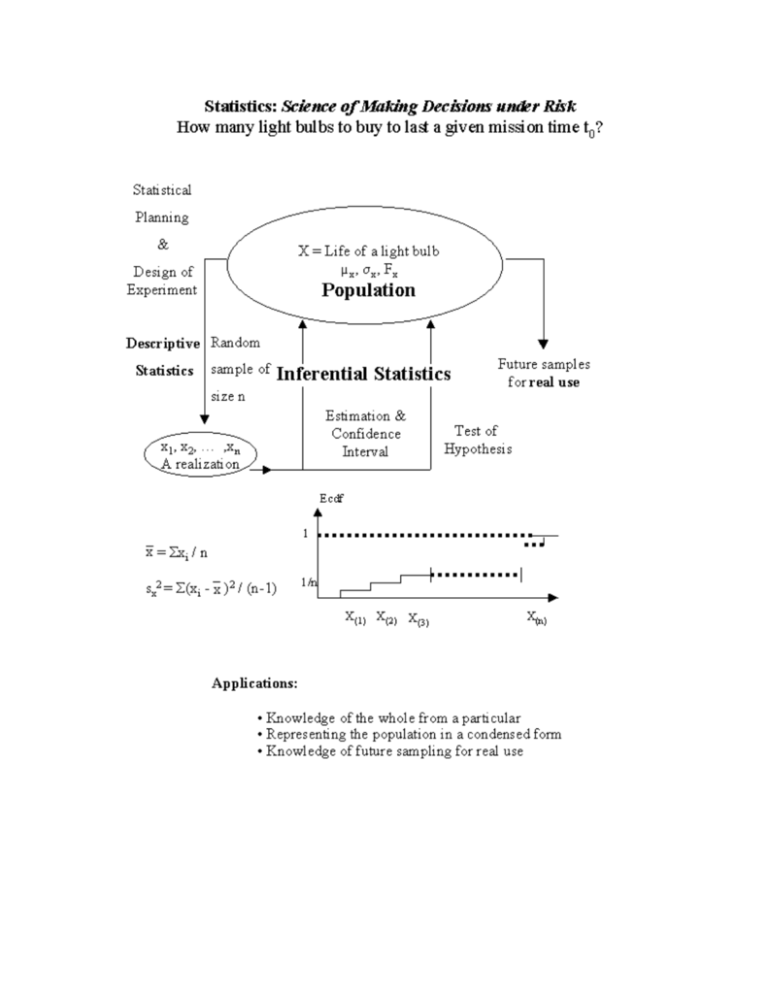
Both functions can be estimated by smoothing the empirical (i.e., observed) cumulative
step-function, and smoothing the histogram constructed from a random sample.
Number of Class Intervals in a Histogram: Before we can construct our frequency
distribution we must determine how many classes we should use. This is purely arbitrary,
but too few classes or too many classes will not provide as clear a picture as can be
obtained with some more nearly optimum number.
An empirical guide known as Sturge's rule, may be used to determine the optimal number
of classes (k) is given by the smallest integer greater than or equal to
Minimum of { n 1/2, 10 Log(n) }, n ≥ 30
where Log is the logarithm in base 10, and n is the total number of the numerical values
which comprise the data set.
Therefore, class width is:
(Highest value - Lowest value) / k
The following JavaScript produces a histogram based on this rule: Test for Homogeneity
of a Population.
A numerical example for some descriptive statistics: Given the following,
small (n = 4) data set, compute the descriptive statistics:
x1 = 1, x2 = 2, x3 = 3, and x4 = 6.
i xi ( xi- ) ( xi - ) 2 ( xi - ) 3 ( xi - )4
1 1
-2
4
-8
16
2 2
-1
1
-1
1
3 3
0
0
0
0
4 6
3
9
27
81
Sum 12 0
14
18
98
The mean
is 12 / 4 = 3; the variance is s2 = 14 / 3 = 4.67; the standard deviation is s =
(14/3) 0.5 = 2.16; the skewness is 18 / [3 (2.16) 3 ] = 0.5952, and finally, the kurtosis is
98 / [3 (2.16) 4] = 1.5.
You might like to use:Descriptive Statistics
http://home.ubalt.edu/ntsbarsh/Business-stat/otherapplets/Descriptive.htm
JavaScript to check your hand computation.
