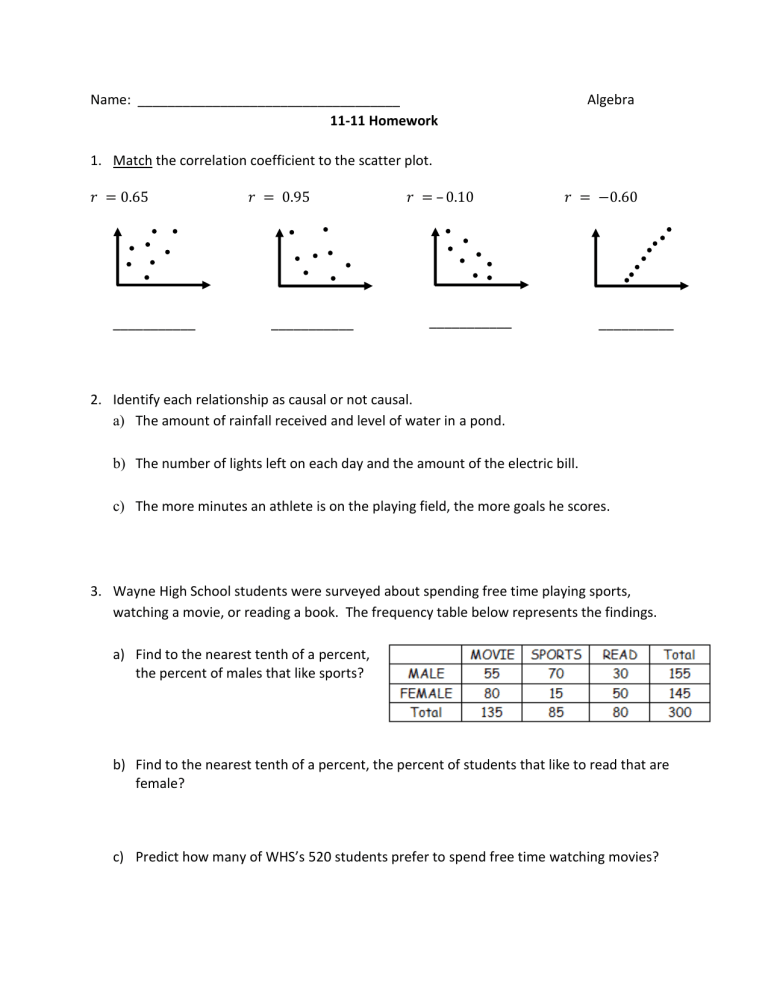
Name: ___________________________________ 11-11 Homework Algebra 1. Match the correlation coefficient to the scatter plot. 𝑟 = 0.65 ___________ 𝑟 = 0.95 ___________ 𝑟 = – 0.10 𝑟 = −0.60 ___________ __________ 2. Identify each relationship as causal or not causal. a) The amount of rainfall received and level of water in a pond. b) The number of lights left on each day and the amount of the electric bill. c) The more minutes an athlete is on the playing field, the more goals he scores. 3. Wayne High School students were surveyed about spending free time playing sports, watching a movie, or reading a book. The frequency table below represents the findings. a) Find to the nearest tenth of a percent, the percent of males that like sports? b) Find to the nearest tenth of a percent, the percent of students that like to read that are female? c) Predict how many of WHS’s 520 students prefer to spend free time watching movies? 4. Use the data below that represents the amount of snow (in inches) that falls in a snowstorm and the number of vehicle accidents that are reported. Amount of Snow 9 # of Accidents 10 10 15 12 25 13 30 14 40 11 20 a) Write the linear regression equation for the data. Round values to the nearest hundredth. b) State the correlation coefficient rounded to the nearest hundredth. c) Interpret the correlation coefficient in the context of the data. 5. Sam surveyed all the kids in her class about how many hours each student spent per week on social media. The results of the survey are listed below: 7, 0, 12, 8, 5, 2, 10, 9, 8, 5, 4, 1 For this data: a) Generate the five number summary (min, Q1, med, Q3, max) b) Create the Box Plot for data on the number line below.

