advertisement
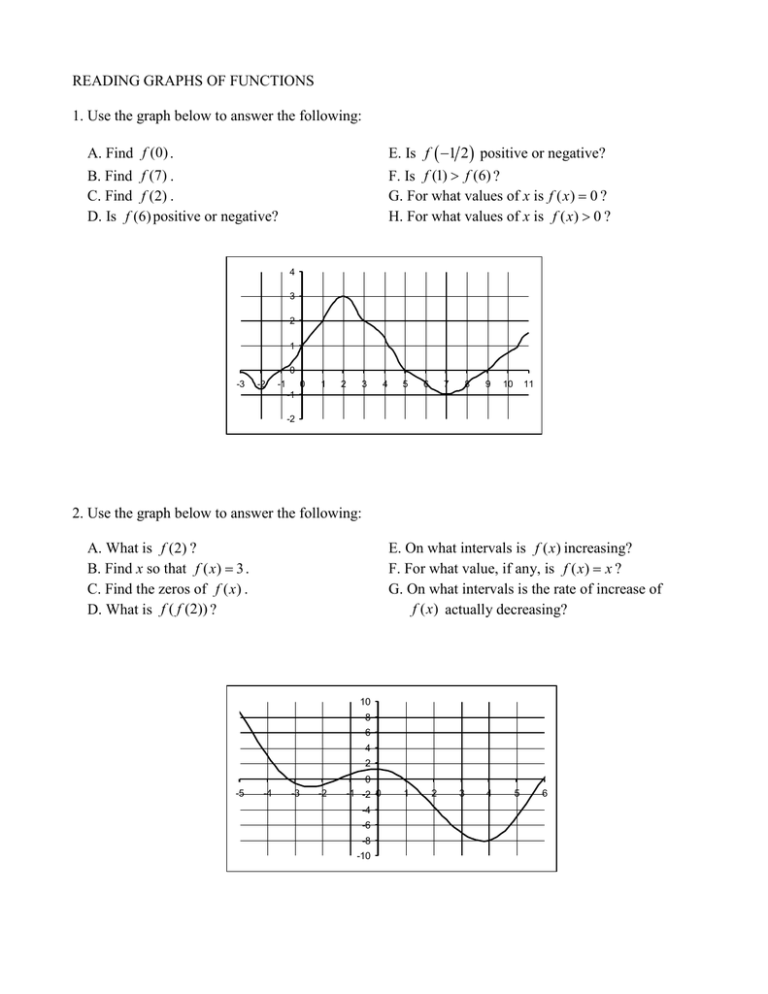
READING GRAPHS OF FUNCTIONS 1. Use the graph below to answer the following: A. Find f (0) . E. Is f 1 2 positive or negative? B. Find f (7) . C. Find f (2) . D. Is f (6) positive or negative? F. Is f (1) f (6) ? G. For what values of x is f ( x ) 0 ? H. For what values of x is f ( x) 0 ? 4 3 2 1 0 -3 -2 -1 0 1 2 3 4 5 6 7 8 9 10 11 -1 -2 2. Use the graph below to answer the following: A. What is f (2) ? B. Find x so that f ( x) 3 . C. Find the zeros of f ( x) . D. What is f ( f (2)) ? E. On what intervals is f ( x) increasing? F. For what value, if any, is f ( x) x ? G. On what intervals is the rate of increase of f ( x ) actually decreasing? 10 8 6 4 2 -5 -4 -3 -2 0 -1 -2 0 -4 -6 -8 -10 1 2 3 4 5 6 3. When a drug is injected into a person’s muscle tissue, the concentration of the drug in the blood is a function of the time elapsed since the injection. Use the graph below to answer the following: ( t 0 corresponds to the time of injection) A. What is the concentration of the drug one hour after the injection? B. Find C (3) and give an interpretation. C. Over what interval is the concentration greater than 0.01? 0.04 Concentration 0.035 0.03 0.025 0.02 0.015 0.01 0.005 0 0 1 2 3 4 5 6 7 Time (hours) 4. The graph below illustrates the temperature on a particular day as a function of time since midnight. A. What was the temperature at 3:00 a.m.? B. When was the temperature 5 degrees? C. When was the temperature below freezing? (less than 0 degrees) D. When was the temperature increasing? 15 Temperature 10 5 0 -5 0 3 6 9 12 15 -10 -15 -20 Hours Since Midnight 18 21 24

