math 137 Unit 2 and 3 project instructions.docx
advertisement

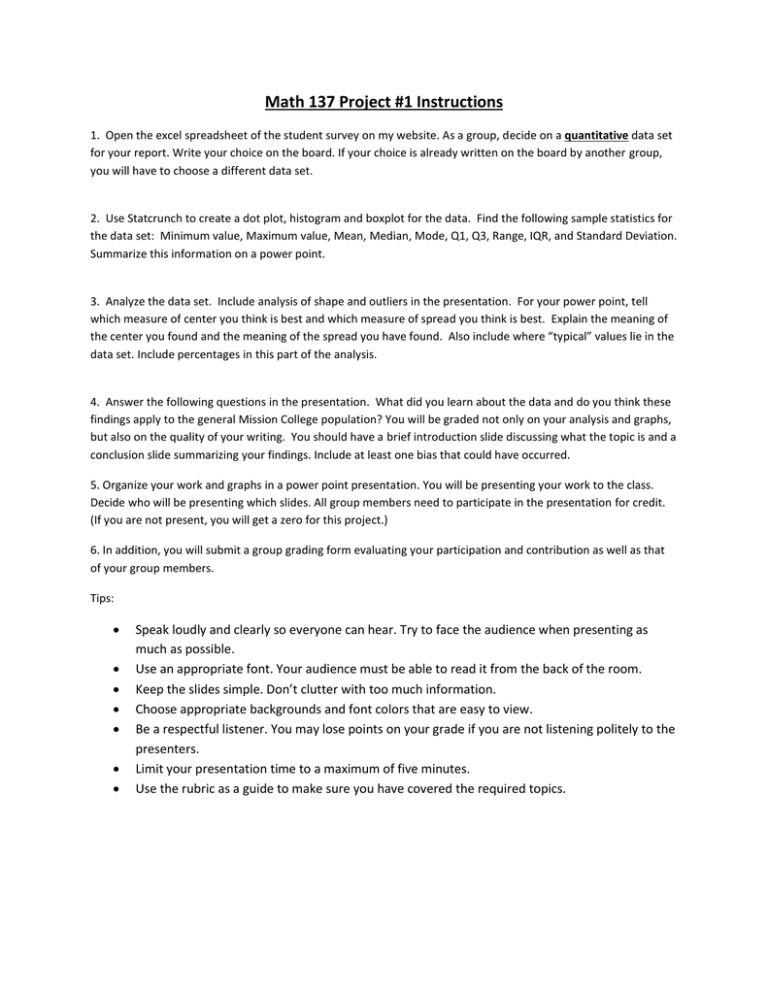
Math 137 Project #1 Instructions 1. Open the excel spreadsheet of the student survey on my website. As a group, decide on a quantitative data set for your report. Write your choice on the board. If your choice is already written on the board by another group, you will have to choose a different data set. 2. Use Statcrunch to create a dot plot, histogram and boxplot for the data. Find the following sample statistics for the data set: Minimum value, Maximum value, Mean, Median, Mode, Q1, Q3, Range, IQR, and Standard Deviation. Summarize this information on a power point. 3. Analyze the data set. Include analysis of shape and outliers in the presentation. For your power point, tell which measure of center you think is best and which measure of spread you think is best. Explain the meaning of the center you found and the meaning of the spread you have found. Also include where “typical” values lie in the data set. Include percentages in this part of the analysis. 4. Answer the following questions in the presentation. What did you learn about the data and do you think these findings apply to the general Mission College population? You will be graded not only on your analysis and graphs, but also on the quality of your writing. You should have a brief introduction slide discussing what the topic is and a conclusion slide summarizing your findings. Include at least one bias that could have occurred. 5. Organize your work and graphs in a power point presentation. You will be presenting your work to the class. Decide who will be presenting which slides. All group members need to participate in the presentation for credit. (If you are not present, you will get a zero for this project.) 6. In addition, you will submit a group grading form evaluating your participation and contribution as well as that of your group members. Tips: Speak loudly and clearly so everyone can hear. Try to face the audience when presenting as much as possible. Use an appropriate font. Your audience must be able to read it from the back of the room. Keep the slides simple. Don’t clutter with too much information. Choose appropriate backgrounds and font colors that are easy to view. Be a respectful listener. You may lose points on your grade if you are not listening politely to the presenters. Limit your presentation time to a maximum of five minutes. Use the rubric as a guide to make sure you have covered the required topics.


