LOESS SOILS EROSION MULTITEMPORAL MEASURMENT USING PHOTOGRAM- METRY AND GEOINFORMATION METHODS
advertisement

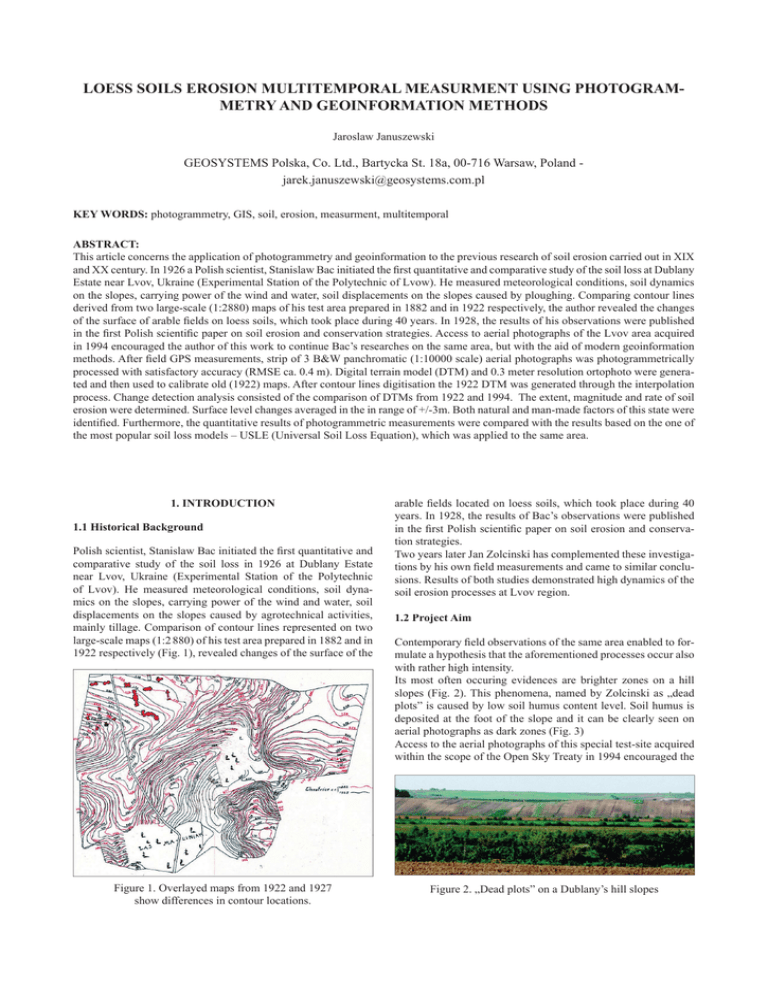
LOESS SOILS EROSION MULTITEMPORAL MEASURMENT USING PHOTOGRAMMETRY AND GEOINFORMATION METHODS Jaroslaw Januszewski GEOSYSTEMS Polska, Co. Ltd., Bartycka St. 18a, 00-716 Warsaw, Poland jarek.januszewski@geosystems.com.pl KEY WORDS: photogrammetry, GIS, soil, erosion, measurment, multitemporal ABSTRACT: This article concerns the application of photogrammetry and geoinformation to the previous research of soil erosion carried out in XIX and XX century. In 1926 a Polish scientist, Stanislaw Bac initiated the first quantitative and comparative study of the soil loss at Dublany Estate near Lvov, Ukraine (Experimental Station of the Polytechnic of Lvow). He measured meteorological conditions, soil dynamics on the slopes, carrying power of the wind and water, soil displacements on the slopes caused by ploughing. Comparing contour lines derived from two large-scale (1:2880) maps of his test area prepared in 1882 and in 1922 respectively, the author revealed the changes of the surface of arable fields on loess soils, which took place during 40 years. In 1928, the results of his observations were published in the first Polish scientific paper on soil erosion and conservation strategies. Access to aerial photographs of the Lvov area acquired in 1994 encouraged the author of this work to continue Bac’s researches on the same area, but with the aid of modern geoinformation methods. After field GPS measurements, strip of 3 B&W panchromatic (1:10000 scale) aerial photographs was photogrammetrically processed with satisfactory accuracy (RMSE ca. 0.4 m). Digital terrain model (DTM) and 0.3 meter resolution ortophoto were generated and then used to calibrate old (1922) maps. After contour lines digitisation the 1922 DTM was generated through the interpolation process. Change detection analysis consisted of the comparison of DTMs from 1922 and 1994. The extent, magnitude and rate of soil erosion were determined. Surface level changes averaged in the in range of +/-3m. Both natural and man-made factors of this state were identified. Furthermore, the quantitative results of photogrammetric measurements were compared with the results based on the one of the most popular soil loss models – USLE (Universal Soil Loss Equation), which was applied to the same area. 1. INTRODUCTION 1.1 Historical Background Polish scientist, Stanislaw Bac initiated the first quantitative and comparative study of the soil loss in 1926 at Dublany Estate near Lvov, Ukraine (Experimental Station of the Polytechnic of Lvov). He measured meteorological conditions, soil dynamics on the slopes, carrying power of the wind and water, soil displacements on the slopes caused by agrotechnical activities, mainly tillage. Comparison of contour lines represented on two large-scale maps (1:2 880) of his test area prepared in 1882 and in 1922 respectively (Fig. 1), revealed changes of the surface of the Figure 1. Overlayed maps from 1922 and 1927 show differences in contour locations. arable fields located on loess soils, which took place during 40 years. In 1928, the results of Bac’s observations were published in the first Polish scientific paper on soil erosion and conservation strategies. Two years later Jan Zolcinski has complemented these investigations by his own field measurements and came to similar conclusions. Results of both studies demonstrated high dynamics of the soil erosion processes at Lvov region. 1.2 Project Aim Contemporary field observations of the same area enabled to formulate a hypothesis that the aforementioned processes occur also with rather high intensity. Its most often occuring evidences are brighter zones on a hill slopes (Fig. 2). This phenomena, named by Zolcinski as „dead plots” is caused by low soil humus content level. Soil humus is deposited at the foot of the slope and it can be clearly seen on aerial photographs as dark zones (Fig. 3) Access to the aerial photographs of this special test-site acquired within the scope of the Open Sky Treaty in 1994 encouraged the Figure 2. „Dead plots” on a Dublany’s hill slopes author of this work to continue Bac’s investigations, with the aid of modern geoinformation methods. The aim of this project was to evaluate quantitatively and qualitatively the soil erosion in Dublany from 1922 to 1994. Usefulness of applied photogrammetric, cartographic and geoinformation methods was also considered. The research was expected to provide answers for two main questions: 1. How much the ground level has been changed during the time span of 72 years? 2. How does the extent and spatial distribution of this process look like? 3. CONCLUSIONS The results of the study led to the following conclusions: 1. Soil erosion processes go on with the same intensity as they went in the beginning of the 20-th century. 2. With the influence of the atmospherical and anthropological factors some hill tops were lowered and the valley bottoms were 2. DATA PROCESSING & ANALYSIS The measurement was based on the comparision of the two digital elevation models representing two ground levels: 1922 and 1994. The ground level change was expected to c.a. 1.5 m and therfore the measurements had to be carried out with possibly high accuracy. Figure 4. Plots with high erosion intensity has high ground surface change factor (see legend on poster) Figure 3. Plot image tone change caused by different superficial soil humus content In the first step, the strip of 3 B&W panchromatic aerial photographs at scale 1:10 000 was scanned (with 24µm scanner aperture) and then photogrammetrically processed. After field GPS measurements, the strip was adjusted with accepted accuracy (RMSE ca. 0.4672 px). DTM for 1994 was produced also with the aid of photogrammetric methods (automatic generation based on image correlation with manual editing). In the next step detailed ortophoto (0.3m ground resolution) was generated. and then used to calibrate large scale (1:2 880) elevation map from 1922. The contour lines with 1m interval were digitised and 1922 DTM was interpolated. After standardization of the type and geometry (raster with 1m spatial resolution), both models were substracted (DTM1994 – DTM1922) and the resulting “diference” map was generated (pixel value represents the ground level change). To complete the analysis and facilitate comparison of the results several series of terrain profiles were generated. These profiles were spatially compatible with those published in Stanislaw Bac’s article in 1928. raised. Amplitude of this change amounts up to 4m (Fig. 4). 3. General tendency of ground flattening can be clearly seen. Rain water moves soil particles down the slope and then deposited material is further moved away from the basin. 4. Erodibility of the Dublany loess soils is very high and it is furthermore strengthen by agrotechnical measures (tillage). Plots on still cultivated slopes are the most severely eroded. 5. Unproper agricultural practices (e.g. up and down tillage) and lack of applied conservation methods in the past decades might have had an influence to speed up the soil degradation. 6. Significant change of the landcover and land-use occured during the investigated period. After 72 years the percentage of built-up area considerably increased. These changes seem to have a serious impact on the ground surface level. In these circumstances, it might be worthy to note that precise determination of all factors responsible for ground displacement over particular locations is simply impossible due to the aforementiond antropogenic changes of the landcover and the land-use. 4. COMPLEMENTARY ANALYSIS In the second part of the project the quantitative results of photogrammetric measurements were compared with the results based on the one of the most popular and widely used soil loss models – USLE (Universal Soil Loss Equation), which was applied to the same area. This analysis led the author to verify the effectiveness of the USLE assessment of the average soil erosion. Data model has been set up on the basis of the precipitation data, topographic information (slope lenght and inclination) , soil erodibility maps, land cover and landuse maps. The model was previously adapted and validated in the south-eastern Poland in ’80 and ’90. All information layers available for Dublany test- site were integrated in raster-based spatial model with the aid of the ERDAS IMAGINE software. Resulting USLE map shows the model’s high sensitivity for both ground slope and land cover type. Total average soil loss from the Dublany polygon estimated with the aid of the USLE was 18423.2 ton/ha/year while the value measured photogrammetrically was adequately 56402.1 ton/ha/year. Comparision of the USLE mean year soil loss map with measured average soil loss map shows that the soil erosion intensity is greater and spatial distribution differs in reality but it is possible to prove some positive correlation between them. The main conclusion from the application of USLE is that the model estimates quite well the soil erosion risk, but takes into consideration not enough factors (including the main, i.e. antropogenic influence) in order to precisely quantify the soil loss . 5. SUMMARY In summary, it was concluded that soil erosion processes at the loess region of Lvov, Ukraine, still take place with high intensity and are practically not mitigated. There is a possibility to measure and/or accurately estimate these processes with high level of precision using modern geoinformation methods. The study was part of the program for M.Sc. Degree of the University of Warsaw. Data acquisition and processing was coordinated by the Geoinformation Education Centre of GEOSYSTEMS Polska Co. Ltd. with substantial aid from the Polish and Ukrainian partners collaborating within the scope of the Open Sky Treaty. The whole project constitutes a good example of the excellent international co-operation between research and educational institutions in both neighbouring countries. Gliński P., Dębicki R., 2000. Ocena zagrożenń erozyjnych oraz charakterystyka jakości wód przy zastosowaniu symulacji komputerowej. Acta Agrophysica, No. 36, Lublin, Poland. Hutchinson, M. F., 1996. A locally adaptive approach to the interpolation of digital elevation models. Third International Conference/Workshop on Integrating GIS and Environmental Modeling Proceedings, National Center for Geographic Information and Analysis, Santa Fe, NM, Santa Barbara, CA, USA. Januszewski J., Kazmir L., 2000. Pierwsze badania procesów erozji w Dublanach. Land Use Planning and Projecting: Experience and Perspectives. - Intemational Collection of Scientific Papers LDAU Lviv - Dybliany, Ukraine, pp. 325-333. Januszewski J., Waszczyk S. M., 2001. Numeryczny model terenu Masywu Dublańskiego – tworzenie i możliwości wykorzystania. Mat. Konferencji „Aktualni problemi zemliewporiadkuwannja”, Dublany, Ukraine. Józefaciukowie C., J., 1996. Mechanizm i wskazówki metodyczne badania procesów erozji. PIOŚ Publ., Warszawa, Poland. Kirkby M. J., 1969. Erosion by Water on Hillslopes. Water, Earth and Man, Chorley Publ., London, UK. Krawczuk J. C., 1999. Navczalno-Kraeznawczij Atłas Lvivsk’oj Oblasti. BNTL Publ., Lvov, Ukraine. Mitasova. H., Hofierka J., Ziocha M., Iverson L.R., 1996. Modeling topographic potential for erosion and deposition using GIS. Int. Journal of Geographical Information Science, 10(5), 1996, pp. 629-641. Morgan R. P. C., 1977. Soil Erosion. Longman Scientific and Technical, London, UK. Oka N., 1998. Application of photogrammetry to the field observation of failed slopes. Engineering Geology, No. 50. Tokarskij J., 1996. Dubliany: istoria agrarnich studij 1856-1946. LDAU, Lvov, Ukraine. References: Bac S., 1928. Przyczynek do badań nad zmianą położenia powierzchni ornych gruntów loesowych. Roczniki Nauk Rolniczych i Leśnych, Dublany, Poland, T. XIX pp. 463. Bac S., 1934. Ruchy warstw gleby pod wpływem zamarzania i rozmarzania. Roczniki Nauk Rolniczych i Leśnych, Dublany, Poland, T. XXXIII, pp. 165. Baldi P., Bonvalot S., Briole P., Marsella M., 2000. Digital photogrammetry and kinematic GPS applied to the monitoring of Volcano Island, Aeolian Arc, Italy. Geophysics Journal International, No. 142. Bergsma E., 1974. Soil Erosion Toposequences on Aerial Photographs. ITC Journal No. 3 Enschede, Netherlands. Blauth J., 1889. Melioracya łąk i pól w Dublanach. Roczniki Krajowej Wyższej Szkoły Rolniczej w Dublanach, T. II Lvov, Poland. Cheng H. H., 2000. Photogrammetric Digital Data Processing of Tsau-Lin Big Landslide. ACRS Proceedings, Taiwan. www.gisdevelopment.net (accessed in June 2003) Fedorowicz-Jackowski W., 1988. Wyznaczanie obszarów o zróżnicowanym stopniu zagrożenia erozyjnego na podstawie zintegrowanych danych teledetekcyjnych i konwencjonalnych. Ph.D. Thesis (typescript) Warsaw, Poland. Fedorowicz-Jackowski W., 1985. Opracowanie mapy zagrożenia erozyjnego wybranego obszaru z wykorzystaniem informacji teledetekcyjnych. Sprawozdanie z badań IGIK, Warsaw, Poland. Żółciński J., 1929. Deluwjalne procesy glebowe. Roczniki Nauk Rolniczych i Leśnych, Dublany, Poland, T. XXII, pp. 278.


