Introduction to 2010 Excel
advertisement
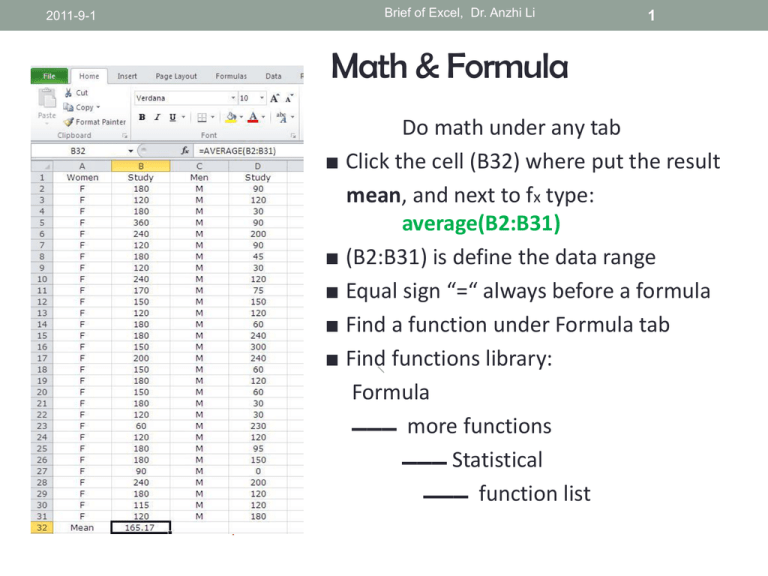
2011-9-1 Brief of Excel, Dr. Anzhi Li 1 Math & Formula Do math under any tab ■ Click the cell (B32) where put the result mean, and next to fx type: average(B2:B31) ■ (B2:B31) is define the data range ■ Equal sign “=“ always before a formula ■ Find a function under Formula tab ■ Find functions library: Formula ▬▬▬ more functions ▬▬▬ Statistical ▬▬▬ function list 2011-9-1 Brief of Excel, Dr. Anzhi Li 2 Statistical Functions (Exampes) • MEDIAN • MEAN • FIRST QUARTILE • THIRD QUARTILE • STANDARD DEVIATION • MINIMUM • MAXIMUM • SUM • CORRELATION COEFFICIENT median(a2:a55) average(a2:a55) quartile(a2:a55, 1) quartile(a2:A55, 3) stdev(b2:b43) min(a2:a67) max(a2:a67) sum(b2:b43) correl(b2:b105,c2:c105) 2011-9-1 Brief of Excel, Dr. Anzhi Li Create A Chart/Plot ■ ■ ■ ■ ■ ■ ■ Highlight the data for plotting Click Insert tab, showing different plots available: ◙ column ◙ bar ◙ line ◙ scatter ◙ pie Select bar plot for example After chart is inserted, more commands show up under Chart Tool Click inside chart : chart tool appear click outside chart : chart tool gone Chart tool - Layout tab – sub commands ◙ chart title ◙ axis title ◙ axes ◙ plot area ◙ gridlines Using above sub-commends to complete a plot 3 2011-9-1 Brief of Excel, Dr. Anzhi Li 4 Create A Histogram: Install Analysis Toolpak ◙ In Excel 2010, click File tab then Options ◙ In Options sub-window, locate and click “Add-Ins” ◙ In the Manage list (bottom), select “Excel Add-ins, and then click Go ◙ In the Add-Ins dialog box, select the Analysis Toolpak check box, then click OK ◙ Under Data tab, click Data Analysis and highlight the Histogram tool, click OK 2011-9-1 Brief of Excel, Dr. Anzhi Li 5 Create A Histogram: Using Histogram Tool ■ We have data shown right: ◙ 1th col: data ◙ 2th col: bin range ■ In the Histogram window ◙ Input Range box: type D1:D36 ◙ Bin Range box: type E1:E6 ◙ Under Output Options, click New Worksheet Ply ◙ Select Chart Output check box Click OK ■ A new Histogram table and a histogram chart are created 2011-9-1 Brief of Excel, Dr. Anzhi Li Create A Histogram Chart • A Histogram table is generated • • • • in a new worksheet A histogram chart is created To adjust the gap between columns Click any column, right click and select “format data series” , change the gap between 0-100% You can adjust the gap 0-10%, or as you like. 6 2011-9-1 Brief of Excel, Dr. Anzhi Li Curve Fitting & Regression Line • Draw a scatter plot without line • Do regression line Insert ▬ Chart Tools ▬ Layout ▬ Trendline ▬ Trendline options & select: ◙ Linear ◙ Display Equation on chart ◙ display R-squared value on chart 7


